Satellites and Data
Himawari: Asian Weather from Orbit in Real Time
From the equator the Himawari satellites photograph Asia and the Pacific every ten minutes. How forecasters, sailors and flood teams read that stream.
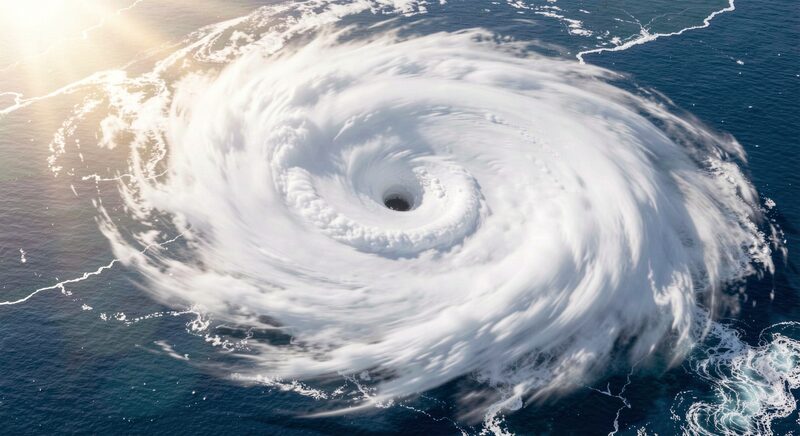
Every ten minutes, around the clock, a camera the size of a car photographs half the planet from a fixed seat 36,000 kilometres above the equator. The Himawari satellites, operated by the Japan Meteorological Agency, watch Asia and the western Pacific in a steady loop that has become the region's shared eye for typhoons, monsoon storms, volcanic ash and haze. This guide explains how the system works, what its images show, and how forecasters, sailors and flood teams read the stream.
Why a satellite can sit still in the sky
Ordinary Earth observation satellites circle a few hundred kilometres up and cross each region briefly, twice a day at best for weather purposes. Himawari instead rides a geostationary orbit, the altitude at which one lap around Earth takes exactly one day, so the satellite hangs over the same spot on the equator, at 140.7 degrees east, within sight of Australia, Japan, Indonesia, India and most of Asia at once. From that seat it cannot swoop close for detail, and its sharpest visible bands resolve about half a kilometre, but it never has to move to keep watching. That single trade, breadth and rhythm over closeness, defines everything the system is used for.
Two spacecraft, one uninterrupted record
The current pair began with Himawari-8, launched in October 2014 and declared operational in July 2015, which introduced the Advanced Himawari Imager with sixteen spectral bands, a step change over the single-band cameras of earlier Japanese weather satellites. Himawari-9, launched in November 2016, sat in reserve for years and took over as the operational spacecraft in December 2022, with its sibling kept nearby as a standby. The two are close enough in design that the record reads as one continuous stream: full views of the Earth disc every ten minutes, and scans of Japan itself every two and a half minutes when weather demands.
What the ten-minute loop shows
Watched as animation, the images stop looking like photographs and start behaving like instruments. A typhoon crossing the Philippine Sea arrives as a spiral whose eye, rainbands and outflow can be tracked hour by hour, giving agencies lead time measured in days. Monsoon thunderstorms over Bangladesh or Jakarta pop up as rapidly brightening cores whose life cycle, often shorter than an hour, fits entirely between two frames of older satellites and unfolds across six Himawari frames. Volcanic ash plumes from Indonesian or Japanese eruptions appear in water-vapour and infrared bands that aviation forecasters use to steer flight corridors. Large fire plumes from Sumatran peatland, dust storms crossing from Inner Mongolia toward Korea, and the spring break-up of sea ice in the Okhotsk Sea all pass through the same loop. The guide to watching Asian air pollution from orbit returns to several of these signatures in detail.
How infrared bands read clouds at night
Half of the loop happens in darkness, so the imager leans on infrared bands that register cloud-top temperature rather than reflected light. Tall thunderstorm clouds, cold at their tops even over a warm afternoon ocean, print as bright patches whose temperature gives an estimate of height. Low stratus and fog, nearly the same temperature as the ground, need the finer bands to separate at all. Combined with water-vapour channels that trace humid layers through the depth of the atmosphere, the night-time product remains a full weather observation, not a placeholder until sunrise. This is also how the loop serves flood teams: the same storm complexes that the radar satellites of the guide to mapping Asian floods see from below, Himawari shows building from above, hours before the rain arrives.
Who publishes the images
The Japan Meteorological Agency publishes real-time imagery freely on its website, a policy that has made Himawari the de facto regional standard far outside Japan. Meteorological services in Australia, Indonesia, the Philippines and the Pacific islands build national products on the stream, research agencies archive it for climate studies, and the images circulate through forecast websites and news bulletins to the general public. The full disc, sector views and animations are all open; what remains restricted is fine engineering data and rapid-scan scheduling, which the agency reserves for its own forecasting. Few datasets of any kind are watched by so many people in Asia each day.
What Himawari cannot do
The system's limits deserve the same clarity as its strengths. Half-kilometre pixels cannot read a street, a field or a landslide scar; for that, the optical and radar satellites described in free satellite imagery of Asia do the work. Geostationary view angles distort toward the horizon, so high-latitude Asia and the western edge of the disc, around the Mediterranean, appear stretched. And ten-minute rhythm, fast as it is, still averages out the briefest gusts and microbursts. Forecasters treat Himawari as the wide context and call the closer fleet for the ground truth, a division of labour that mirrors the one between the sections of this magazine.
Seeing the disc for oneself
The stream is public, and a reader can watch it directly. The agency's Himawari real-time image page publishes the latest full-disc views and recent sector images, updating as each scan completes. An hour spent with the day's animation, watching one weather system cross the region, teaches more about the scale of Asian weather than any description can.