Land, Water and Cities
What Satellites See of Asian Land, Water and Cities
Monsoon floods, rice harvests, megacities that double in a decade and haze that crosses borders: a tour of the Asian questions satellite images answer well.
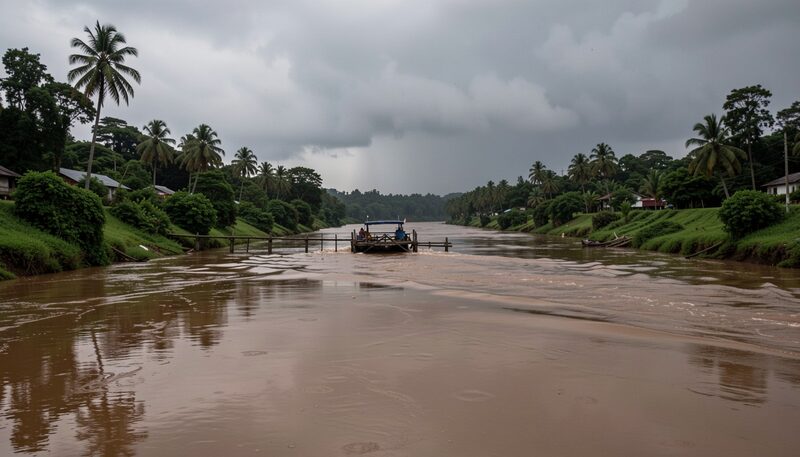
Asia is where satellite imagery earns its keep. The continent holds the world's densest monsoon rhythms, its most harvested crop, its fastest urban growth and its most watched skies, and each of those realities has a signature in orbit data. This section of the magazine tours the Asian questions that remote sensing answers well, from flood extent to haze, and explains for each what the images show and who acts on the result.
Why the region reads so clearly from orbit
Three circumstances make Asia a natural observatory. The physical contrasts are sharp: flooded paddies beside dry terraces, megacity blocks beside paddy fringe, clear monsoon air beside haze episodes hundreds of kilometres wide. The change rates are high: rivers migrate in single seasons, cities double their footprint within a planning generation, and storm systems complete their life cycle within a satellite's revisit cycle. And the stakes concentrate millions of people in exactly the places the instruments see best, deltas, coasts and floodplains. When a sensor record and a human question line up this well, the maps that follow stop being technical products and become part of how the region is governed.
Water that arrives all at once
Each monsoon season, rivers across the Brahmaputra, Mekong, Chao Phraya and Yangtze basins leave their channels and spread across floodplains where hundreds of millions of people live. Satellite radar, indifferent to the cloud that accompanies the rain, maps the standing water within hours and repeats the measurement daily while the crest moves downstream. The resulting extent maps guide relief distribution, road closures and embankment inspection, and after the water drains they feed the studies that decide where the next season's defences stand. The guide to mapping Asian floods from orbit follows the method step by step, from raw radar scene to validated water mask.
The crop that feeds the continent
Rice covers more Asian soil than any other crop, and it grows in a way that satellites read with unusual ease: flooded at planting, green through the season, bare at harvest. Time series of optical and radar images catch each stage, which turns into planted-area estimates, crop calendars for whole deltas and early warnings when a season runs late. Because harvest prospects move national food policy, the paddy maps made from orbit travel from research institutes to ministries within the same season they observe. The guide to rice paddies seen from orbit explains how a season becomes a map, and where the estimates remain uncertain.
Cities that grow faster than their maps
From orbit, an Asian megacity reads as a spreading stain of bright, dense pixels at the centre and converted farmland at the edge. Jakarta, Dhaka, Manila and Chengdu are the emblematic cases, but the pattern repeats in scores of second-tier cities whose planning maps lag years behind reality. Satellite time series measure the growth directly: the same tiles, decades apart, show the fringe villages that became districts and the paddies that became suburbs. Those measurements feed the urban research that tracks infrastructure shortfalls, heat exposure and flood risk. The guide to how Asian megacities grow presents the evidence and the method behind it.
Air that crosses borders overnight
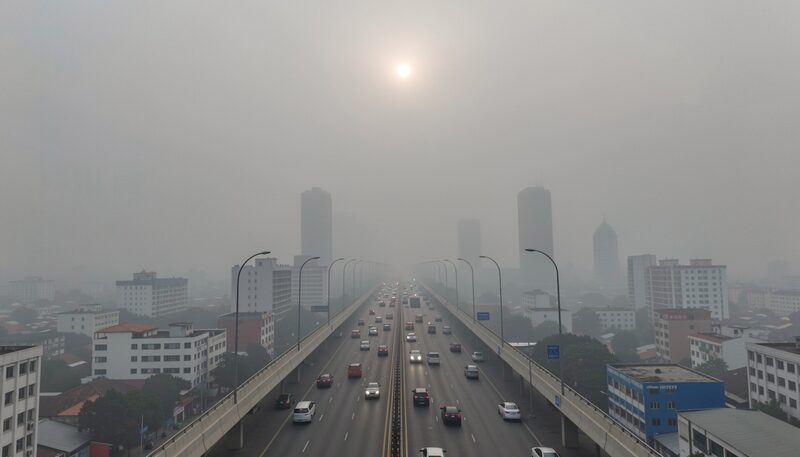
The region's haze episodes ignore the boundaries that the other themes respect. Smoke from burning peatland drifts across the Strait of Malacca and the South China Sea; dust from continental deserts reaches Korea and Japan; industrial plumes pool over basins in winter. Instruments that measure the atmosphere rather than the surface, described in the guide to watching Asian air pollution from orbit, trace these events across borders and feed the health advisories that schools and clinics act on. Because the sources and the victims sit in different countries, the satellite record often serves as the shared factual baseline for the regional discussion.
What holds the four themes together
Floods, rice, cities and haze differ in every obvious way, yet the working method is one. Each starts from a repeated observation of the same ground, builds a time series rather than a snapshot, and ends in a product someone outside the mapping team can act on. Each leans on the free and national archives surveyed in choosing satellite data for work in Asia, and each survives scrutiny only when its maps are checked against the ground in the discipline described under ground truth. The readers who follow those threads through this section will meet the same instruments, and the same honesty about uncertainty, in every story.
Land, Water and Cities
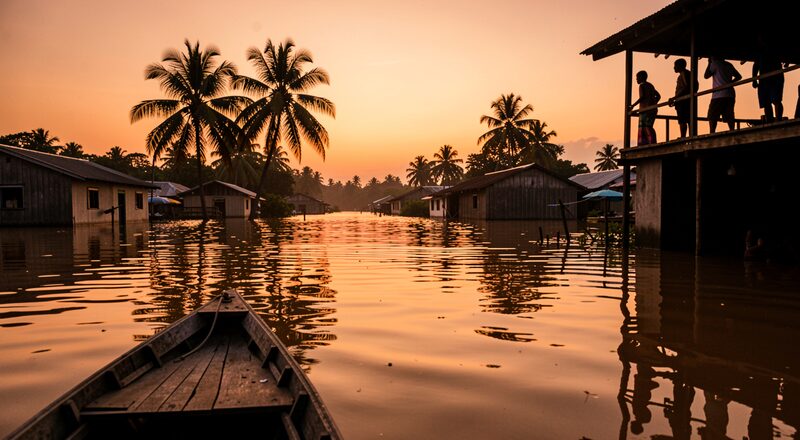
Mapping Asian Floods From Orbit
When monsoon rivers rise, radar satellites see through cloud and map the water. How flood extent maps are built and used, from relief to river basin planning.
Radar finds the water under monsoon cloud.
Land, Water and Cities
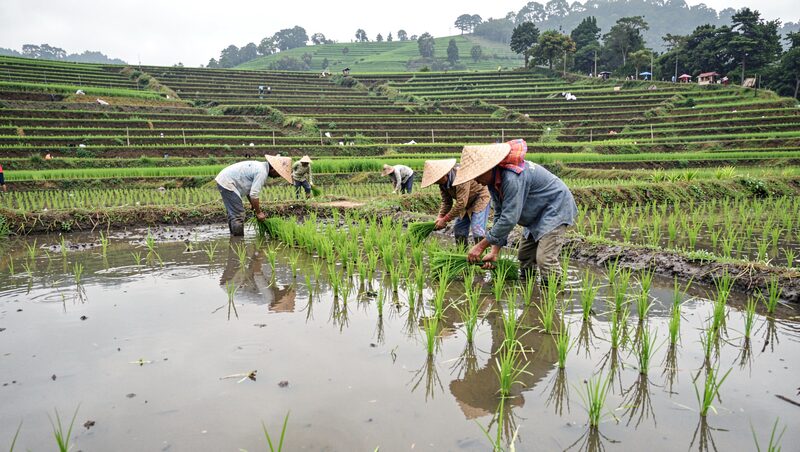
Rice Paddies Seen From Orbit
Rice grows in flooded fields that satellites read well. How time series track planting, flooding and harvest, and why forecasts start with a good paddy map.
A paddy season followed week by week.
Land, Water and Cities
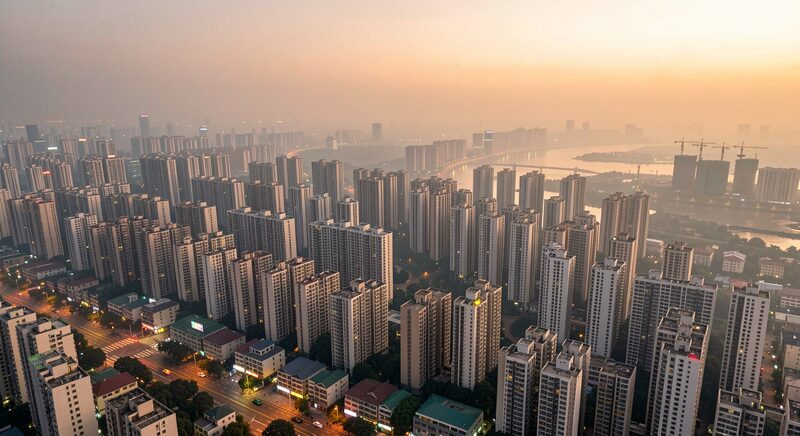
How Asian Megacities Grow, Seen From Orbit
Jakarta, Dhaka, Manila and Chengdu keep spilling outward. How image time series measure urban growth, and why planners watch the fringe, not the skyline.
The fringe grows faster than the skyline.
Land, Water and Cities
Watching Asian Air Pollution From Orbit
Haze does not stop at borders. Sensors such as Sentinel-5P and GOSAT track the gases above Asian cities, and the maps feed health advisories.
The haze season has a satellite clock.