Land, Water and Cities
How Asian Megacities Grow, Seen From Orbit
Jakarta, Dhaka, Manila and Chengdu keep spilling outward. How image time series measure urban growth, and why planners watch the fringe, not the skyline.
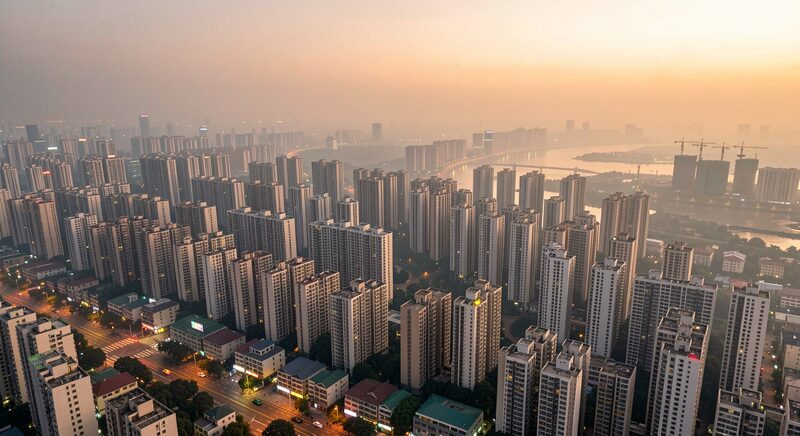
Seen from orbit at night or by day, the story of Asian cities is a story of surfaces changing state: dark paddy to bright concrete, mud bank to port, village grid to megacity block. More than half of humanity's urban growth this century is happening in Asia, and much of it outpaces the official maps meant to record it. Satellite time series measure that growth directly, decade by decade and district by district, and the measurements now anchor the research on infrastructure, heat and flood exposure that follows. This guide explains how urban growth is read from orbit, which cities anchor the record, and what the pixels can and cannot testify to.
What a city looks like to a sensor
Built-up land has a physical signature that satellites pick up without much ambiguity. Concrete, asphalt and roofing scatter shortwave infrared light more strongly than vegetation and less than bare soil, so a standard band combination shows urban area in a distinct colour that a classifier can trace. Density adds texture: megacity cores form fine, repeating patterns of small bright and dark parcels, while informal settlements print as grey, low-contrast fabric with irregular lanes. The change over time is what matters most, and the guide to free satellite imagery of Asia explains why the Landsat archive, forty years deep and thirty-metre sharp, is the backbone of that comparison: the same tile from 1990 and from today, classified the same way, yields the growth map directly.
The emblematic cases
Certain Asian cities have become the reference studies of the field because their growth is fast, well observed and consequential. Jakarta spreads across a delta whose northern districts sink as groundwater is drawn down, combining horizontal growth with a vertical problem, subsidence, that radar interferometry measures millimetre by millimetre. Dhaka adds several hundred thousand residents in many years, most settling on low land around the metropolitan edge, and its expansion map doubles as a flood-exposure map. Metro Manila grows against hard physical limits, water to the west and hills east, so its footprint thickens and fills rather than spreads. In China, Chengdu and its peers grew in the planned, concentric pattern of a national programme that converted farmland to districts at a pace visible from orbit within single years. The method is one, the trajectories differ, and the comparison between them is exactly what the satellite record makes possible.
How a growth map is built
The production chain rhymes with the crop and flood chains elsewhere in this magazine. Scenes from two or more dates are selected, preferably the same season to keep vegetation state comparable, and classified into built-up and not-built-up, either by rule-based interpretation or by machine learning models trained on hand-labelled examples. The two layers are then overlaid, and every pixel that flipped from non-urban to urban is marked as new urban land. Summed by district or province, the flip count becomes the growth statistic. The long-cited comparative studies of global urban expansion lean on exactly this procedure at coarse resolution, and the public Atlas of Urban Expansion publishes the resulting maps and numbers for cities worldwide, Asian megacities prominent among them.
What only sharper satellites can see
Thirty-metre pixels can trace a footprint but not a street. When the question narrows to building stock, road width, informal settlement boundaries or rooftop solar potential, the work moves to the sub-metre imagery of commercial constellations and to the high-resolution national satellites surveyed in the guide to Asia's own Earth observation satellites, several of which fly over Asian cities on regular schedules. That finer tier changes what is measurable: dwelling counts in settlements that censuses under-reach, port container throughput estimated from stacking-area images, and the vertical growth measured by matching stereo pairs. The trade-off between breadth of record and sharpness of view, developed generally in the guide to choosing satellite data for work in Asia, lands hardest in urban work, where both matter.
Why the growth maps have consequences
The footprint layer feeds decisions several steps removed from mapping. Growth direction against floodplain topography becomes risk exposure, and several Asian cities now maintain satellite-based risk maps that steer where public housing and infrastructure are built. Loss of farmland at the fringe, paddy converted to suburb in the orbit of expanding metros, links the urban story to the crop story of the guide to rice paddies seen from orbit. The urban heat island, measurable in thermal bands as a brightness difference between core and fringe, feeds the heat-action planning now common across South and Southeast Asia. And the air shed of a growing megacity, watched by the atmospheric instruments described in the guide to watching Asian air pollution from orbit, is the growth map's companion layer, because the same expansion that changes the surface changes what the air carries.
The uncertainties worth naming
Classification is judgement rendered automatic, and it inherits judgement's problems. Built-up pixels are confused with bare dry ground, quarries and construction sites that may or may not become districts, and the coarse resolution mixes gardens and lanes into single pixels. Administrative definitions of urban disagree with pixel definitions, so satellite-derived populations are estimates with attached error, not censuses. Seasonal flooding changes the same pixel's appearance within a year, which is why the strong studies classify same-season pairs and validate against points on the ground, the discipline described under ground truth. Handled honestly, these limits define what the maps can testify to: the where and how fast of physical growth, verified across decades, in the cities tracked through the section on land, water and cities.