Land, Water and Cities
Rice Paddies Seen From Orbit
Rice grows in flooded fields that satellites read well. How time series track planting, flooding and harvest, and why forecasts start with a good paddy map.
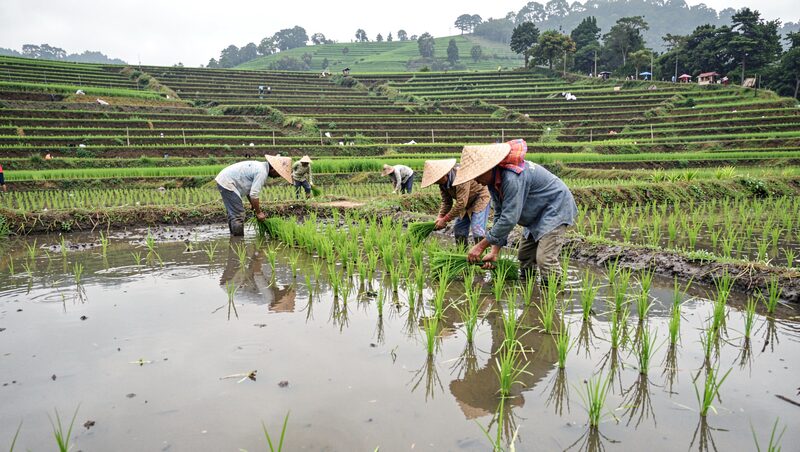
Rice is the one crop whose cultivation method mimics a flood, and that accident of agronomy is the reason satellites map it better than almost anything else grown in Asia. A paddy is deliberately submerged at transplanting, grows into a dense green canopy, and is drained bare at harvest, a three-act sequence that prints unmistakably across an optical or radar time series. From those prints, mapping services estimate planted area, follow crop calendars across entire deltas and flag seasons that run late. This guide explains how a rice map is actually built, and why its remaining uncertainties matter for the food forecasts built on top.
The signature a satellite looks for
The key moment is transplanting, when farmers move seedlings from nursery to fields flooded to a shallow depth. In the weeks before the canopy closes, a transplanted field is open standing water, and each satellite instrument reads that water in its own dialect. Optical sensors record a sudden drop in reflectance and a strong signal in the shortwave infrared bands, which absorb water aggressively. Radar sees the same event as the low-return dark surface described in the guide to mapping Asian floods, because smooth shallow water reflects the pulse away. Weeks later the story inverts: the canopy rises, green reflectance climbs, and the field becomes one of the brightest vegetated surfaces in the region, before everything drops again at drain and harvest. No other major Asian crop floods on purpose, so the flood-then-green sequence separates rice from maize, soy and orchard with little argument.
Why one image is never enough
A single scene cannot distinguish a flooded paddy from a fish pond, a river backwater or a salt flat, and the monsoon guarantees that single scenes are often cloudy anyway. The method is therefore the time series: the same field, observed every few days across the whole season, strung into a curve whose shape is the crop calendar. Teams work in the two archives described in the guide to free satellite imagery of Asia, Sentinel-2 for its ten-metre detail and red-edge bands, Landsat for the decades-long record, and they fill cloud gaps either with composites or with radar, which watches the flood-transplanting moment straight through the weather. The platforms compared in the guide to Google Earth Engine and QGIS made this style of work routine, because they hold entire season stacks ready for analysis instead of requiring each scene to be downloaded by hand.
What the finished products look like
Three layers usually leave the laboratory. A planted-area map answers how many hectares of rice stand in a province this season, at ten-metre or coarser resolution, with an accuracy figure attached. A crop calendar map answers when each district transplanted, which sounds academic until a delayed transplant signals a coming harvest delay and a market or food-security consequence. A condition layer flags where the canopy is developing behind normal, from flood damage, drought or pest stress. Folded together, these layers are the early-warning raw material that national agencies and international monitors consult, and public examples of the harvest of such systems appear in the international Crop Monitor reports, which synthesise satellite evidence into monthly outlooks by country.
Where the method gets hard
Four difficulties absorb most of the working effort. Cloud cover over the wet-season crop, the most important one, forces reliance on radar and composites, each bringing its own noise. Smallholder fragmentation means a single ten-metre pixel can straddle a paddy bund, a path and a vegetable plot, so area estimates carry a resolution penalty that coarse national statistics escape. Mixed calendars overlap in the same landscape, since irrigation lets some districts grow two or three crops a year while rain-fed neighbours grow one, and the curves must be separated per field rather than per province. And aquaculture competes directly with the signature: a shrimp pond is water, then a harvested bare pond, in a rhythm close enough to rice that interpreters lean on shape, bund geometry and time of year to tell them apart. Each difficulty is managed, not solved, and the honest maps say which.
How accuracy is actually established
A rice map earns trust the same way every map in this magazine does, through points checked on the ground. Teams assemble a validation set, fields whose crop and transplanting date were recorded by local partners or enumerators, run the classifier blind over them, and report the confusion: rice read as water, water read as rice, one crop year read as two. Independent cross-checks use administrative statistics, where they exist and are believed, and the strong regional programmes publish their accuracy rather than asserting it. The field discipline behind such samples is the subject of the guide to ground truth, and paddy mapping is one of its biggest consumers, because a mislabelled district propagates into harvest forecasts that ministries act on.
Who the maps are for
The audiences stack in layers of consequence. A provincial agriculture office uses transplanting maps to schedule water releases and extension visits. A national food agency uses planted-area and condition layers to decide import and stock policy months before harvest figures arrive. Insurers in several Asian countries now price crop policies against satellite-derived damage rather than paper claims alone. Researchers use the multi-decade record to study how shifting calendars track a changing climate, the long view introduced in the section on land, water and cities. One crop, one observable behaviour, and a satellite record patient enough to watch it every few days for years: that combination is why rice mapping remains the flagship application of Asian agricultural remote sensing.