Land, Water and Cities
Watching Asian Air Pollution From Orbit
Haze does not stop at borders. Sensors such as Sentinel-5P and GOSAT track the gases above Asian cities, and the maps feed health advisories.
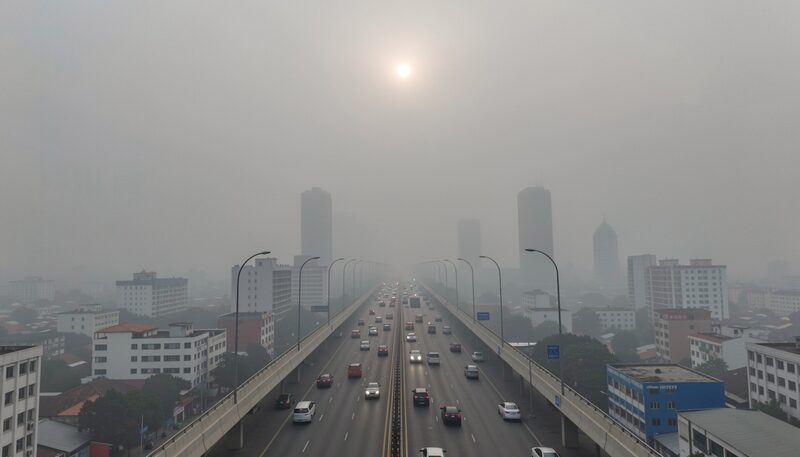
The instruments described elsewhere in this magazine photograph the ground. The ones in this guide photograph the air, and over Asia they watch a story that crosses borders faster than any diplomatic note: haze from burning peatland drifting across sea lanes, dust from continental deserts reaching Korean and Japanese cities, industrial plumes pooling in winter basins. Atmospheric satellites trace these events at continental scale, day after day, and their record has quietly become the shared factual baseline for the region's air-quality disputes. This guide explains which instruments watch Asian air, what they measure, and how their data reaches the advisories people act on.
What the satellites actually measure
Air-quality sensors do not see a smoke plume the way a camera sees a river. They measure sunlight that has passed through the atmosphere and been partly absorbed by gases on the way, and from the absorption fingerprints they retrieve columns of nitrogen dioxide, sulphur dioxide, carbon monoxide, ozone and aerosol particles, counted as the amount sitting above each square of ground. The retrieval is indirect, model-assisted, and reported with uncertainties, which is why the field speaks of column density rather than a concentration at street level. But the patterns the columns trace are unambiguous: a plume has a shape, a direction and a history, and over Asia the satellites watch them form, travel and decay in near-real time.
The European workhorse: Sentinel-5P
The single most-used instrument for Asian air is TROPOMI, flying on the European Sentinel-5P satellite launched in 2017. It maps the whole planet daily at resolution fine enough, better than a few kilometres in the best case, to separate a harbour industrial zone from the residential city behind it, and it serves its data free within hours. Nitrogen dioxide is its signature product: emitted by traffic, power generation and industry, short-lived in the atmosphere, and therefore an almost literal photograph of where combustion happens. The weekly rhythm of Asian economic activity is visible in the record, weekday peaks easing on weekends, and the sudden regional quiet of 2020 remains the unplanned experiment that showed how much of the region's NO2 was human rather than natural. Sulphur dioxide from volcanoes and shipping, carbon monoxide from fires, and aerosol indices join the product line, which is why TROPOMI scenes appear in everything from research papers to newspaper graphics.
Japan's greenhouse gas watchers
For the longer-lived gases the relevant fleet is Japanese. GOSAT, launched in 2009, was the first satellite dedicated to measuring carbon dioxide and methane from space, and GOSAT-2, flying since 2018, added carbon monoxide and finer sampling. These instruments work differently from air-quality sensors, targeting the absorption bands of greenhouse gases and sampling rather than scanning, and their product is a column-average mixing ratio used to constrain national and regional budgets rather than to spot any single source. Their contribution to the Asian picture is the slow layer: not today's haze, but whether the region's carbon and methane trajectories bend as inventory reports claim. For the fast layer of particles and smoke, the geostationary loop of Himawari contributes aerosol and dust signatures every ten minutes, day and night, a rhythm no polar orbiter matches.
Reading an Asian haze season
A single season shows the fleets working together. Late in a dry year, fires start on drained peatland as agricultural clearing spreads; TROPOMI's aerosol and carbon monoxide products show the emission hotspots appearing. Winds carry the smoke across the Strait of Malacca or the South China Sea, and the plume's travel is followed in daily maps while ground stations in the receiving countries record the particulate spikes when it arrives. Health advisories close schools and mask recommendations are issued on the strength of the combined record, and when the diplomatic correspondence begins, the satellite columns are among the few datasets both sides accept. The same choreography repeats with spring dust from continental deserts toward Korea and Japan, and with winter pollution episodes that pool over basin cities such as those tracked in the guide to how Asian megacities grow, where the emissions and the exposed populations live in the same footprint.
How close the satellites come to the street
The honest limit bears repeating: a satellite retrieves the whole column of gas above a point, not the concentration a person breathes at pavement level. Under a stable winter inversion, column and surface concentrations track each other closely, and the maps are read almost literally. Under loose summertime mixing, the column can be dominated by smoke aloft while the street stays breathable, or the reverse. Operational systems therefore fuse satellite columns with ground monitors and forecast models, using the satellites' breadth and the stations' ground truth, the same division of labour this magazine describes throughout. Readers who want the raw view can browse daily global imagery, including aerosol and fire layers over Asia, on NASA's open Worldview interface, no registration required.
Why the atmospheric record endures
Episodes pass, but the archive stays, and its length is becoming the point. Multi-year NO2 records show which industrial corridors cleaned up and which grew; fire-season statistics computed from two decades of observations show the peatland years that were exceptional; the greenhouse gas series lengthens toward climate-assessment relevance. The air over Asia is the continent's most shared natural resource, in the sense that no border stops it for a day, and the satellites described here are the only observers that watch all of it, all the time, with the same instrument. That combination, introduced with the other sensor families in the guide to choosing satellite data for work in Asia, is what makes the atmospheric layer a permanent part of the regional record surveyed in the section on land, water and cities.